CI/CD Pipeline Best Practices That Engineering Teams Actually Use in 2026

Most teams have a CI/CD pipeline. Far fewer teams have a CI/CD pipeline that actually works well under pressure.
There is a big gap between a pipeline that technically exists and one that gives developers confidence, ships code reliably, and catches problems before they reach real users. In 2026, with GitHub Actions leading adoption at 33 percent of organizations, Jenkins holding steady at 28 percent, and GitLab CI growing fast, the tooling question is mostly settled. The harder question is how you use those tools well.
This post covers the CI/CD pipeline best practices that engineering teams are actually applying in production environments right now. Not theoretical recommendations. The things that separate teams deploying multiple times per day from teams dreading every release.
What Is a CI/CD Pipeline and Why Does It Break Down
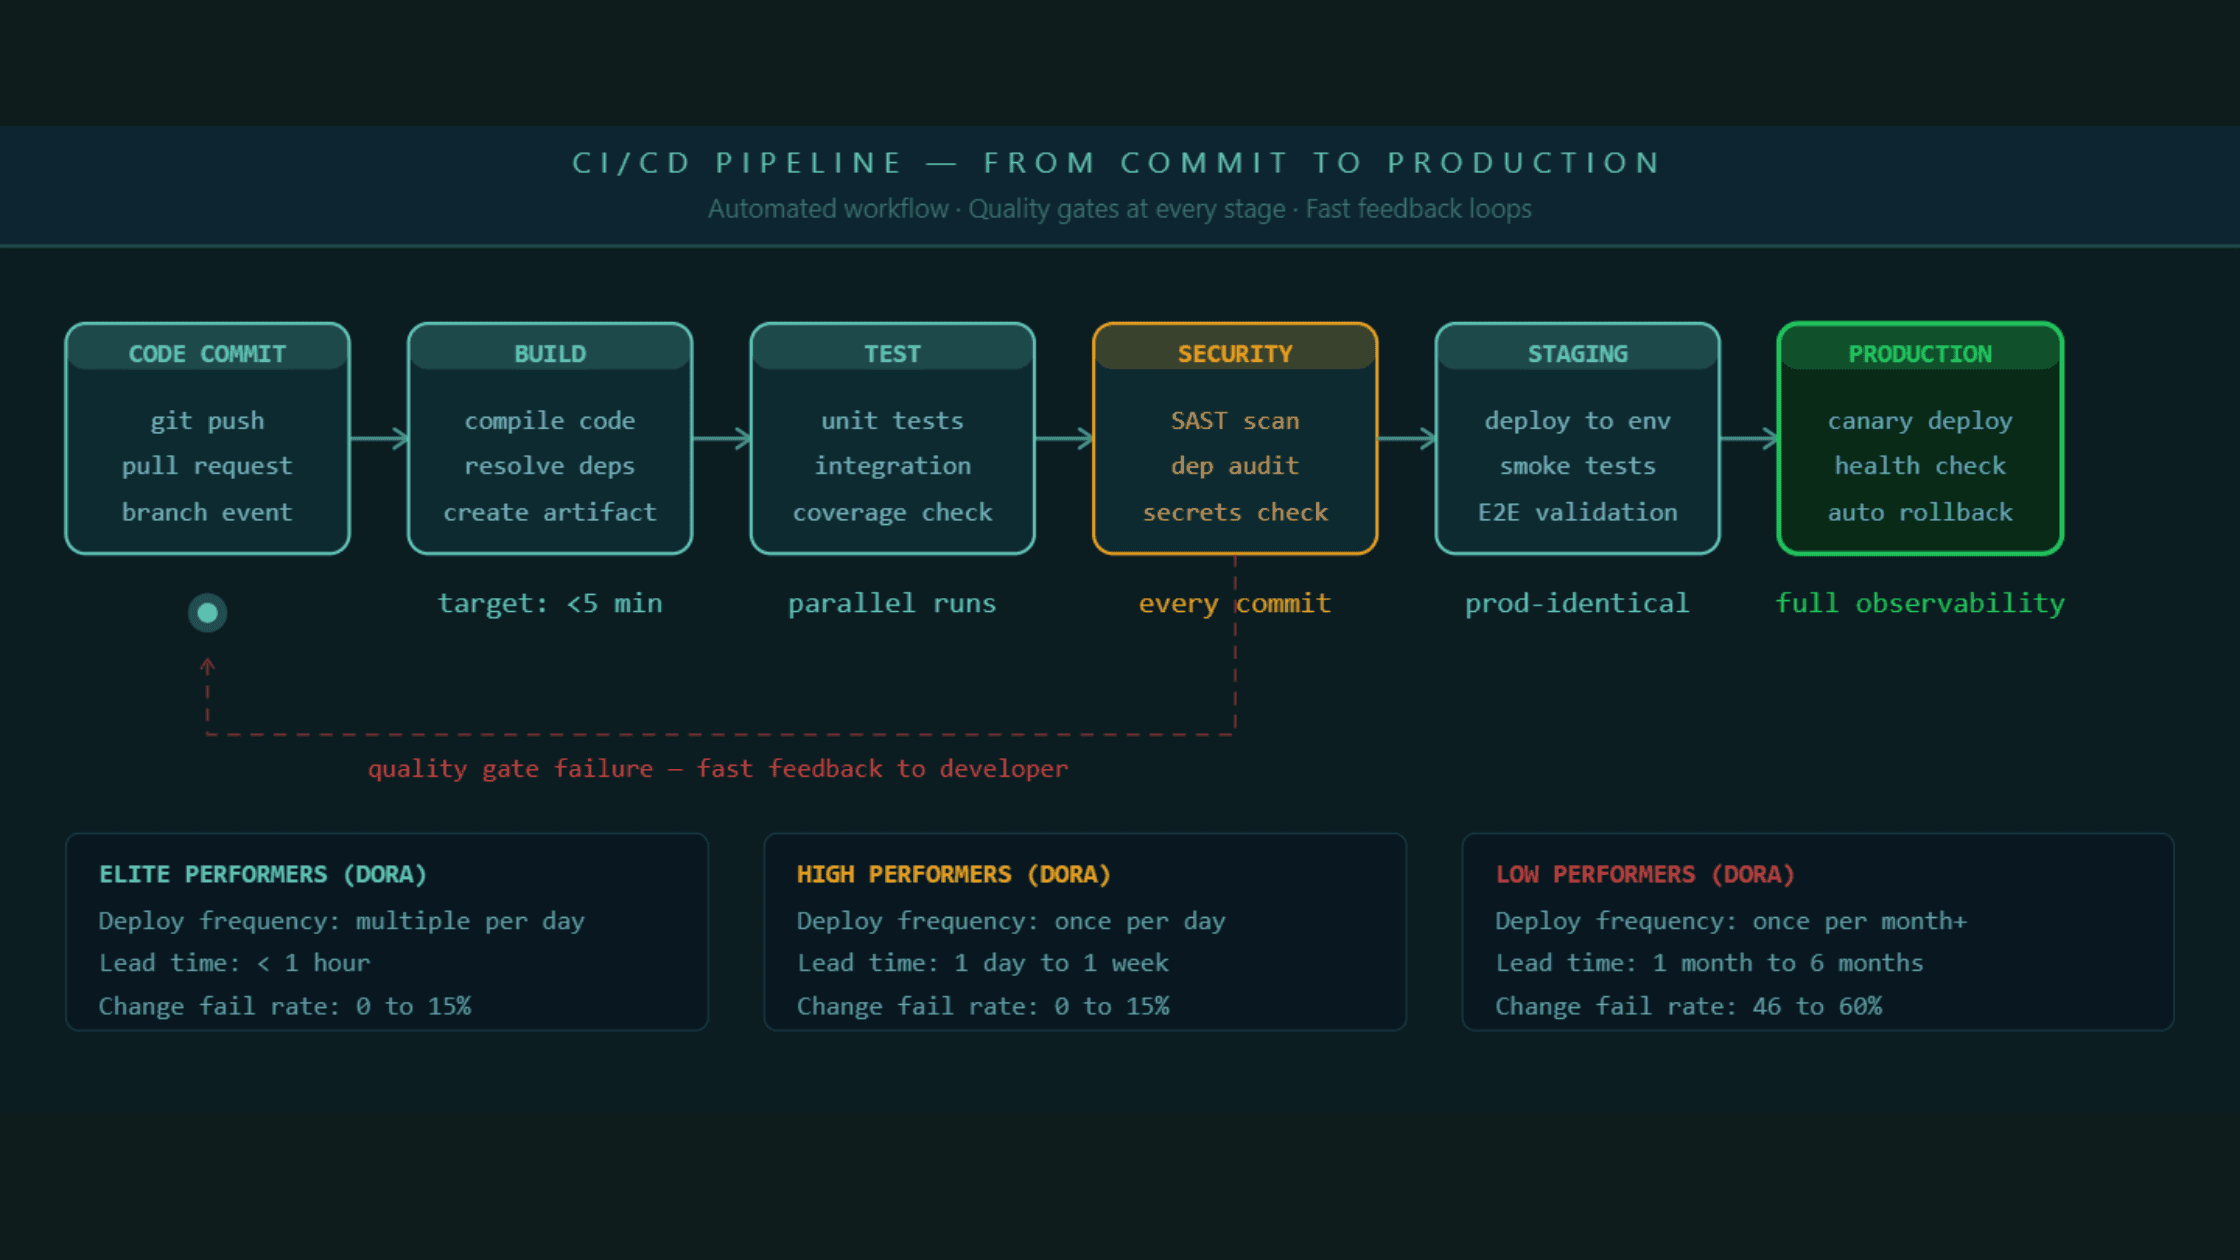
A CI/CD pipeline is the automated workflow that takes code from a developer's commit through build, test, and deployment, all the way to production. Continuous integration handles the building and testing part. Continuous delivery or deployment handles getting that tested code into environments reliably and fast.
The reason most pipelines underperform is that they were built reactively. A team adds a step when something breaks in production. They add another step when a security audit flags a gap. Over time the pipeline becomes a patchwork of disconnected jobs that nobody fully understands and everyone blames when a release goes wrong.
The best pipelines are designed intentionally from the start, with clear ownership of each stage, defined quality gates, and a measurable standard for what "passing" actually means.
A CI/CD pipeline that was built reactively will always feel fragile. The best pipelines are designed with clear quality gates and ownership before the first stage is wired up.
Best Practice 1: Keep Your Build Under Ten Minutes, No Exceptions
If your CI build takes longer than ten minutes, developers stop waiting for it. They move on to the next task, lose context, and when the build finally finishes they have to mentally re-enter the problem they were solving. Research from the Continuous Delivery Foundation shows that context-switching costs exceed the cost of faster build infrastructure for almost every team.
The ten-minute rule is not arbitrary. It is the threshold at which developers stay engaged with a failing build rather than context-switching. Beyond ten minutes, your pipeline is actively slowing your team down every time it runs.
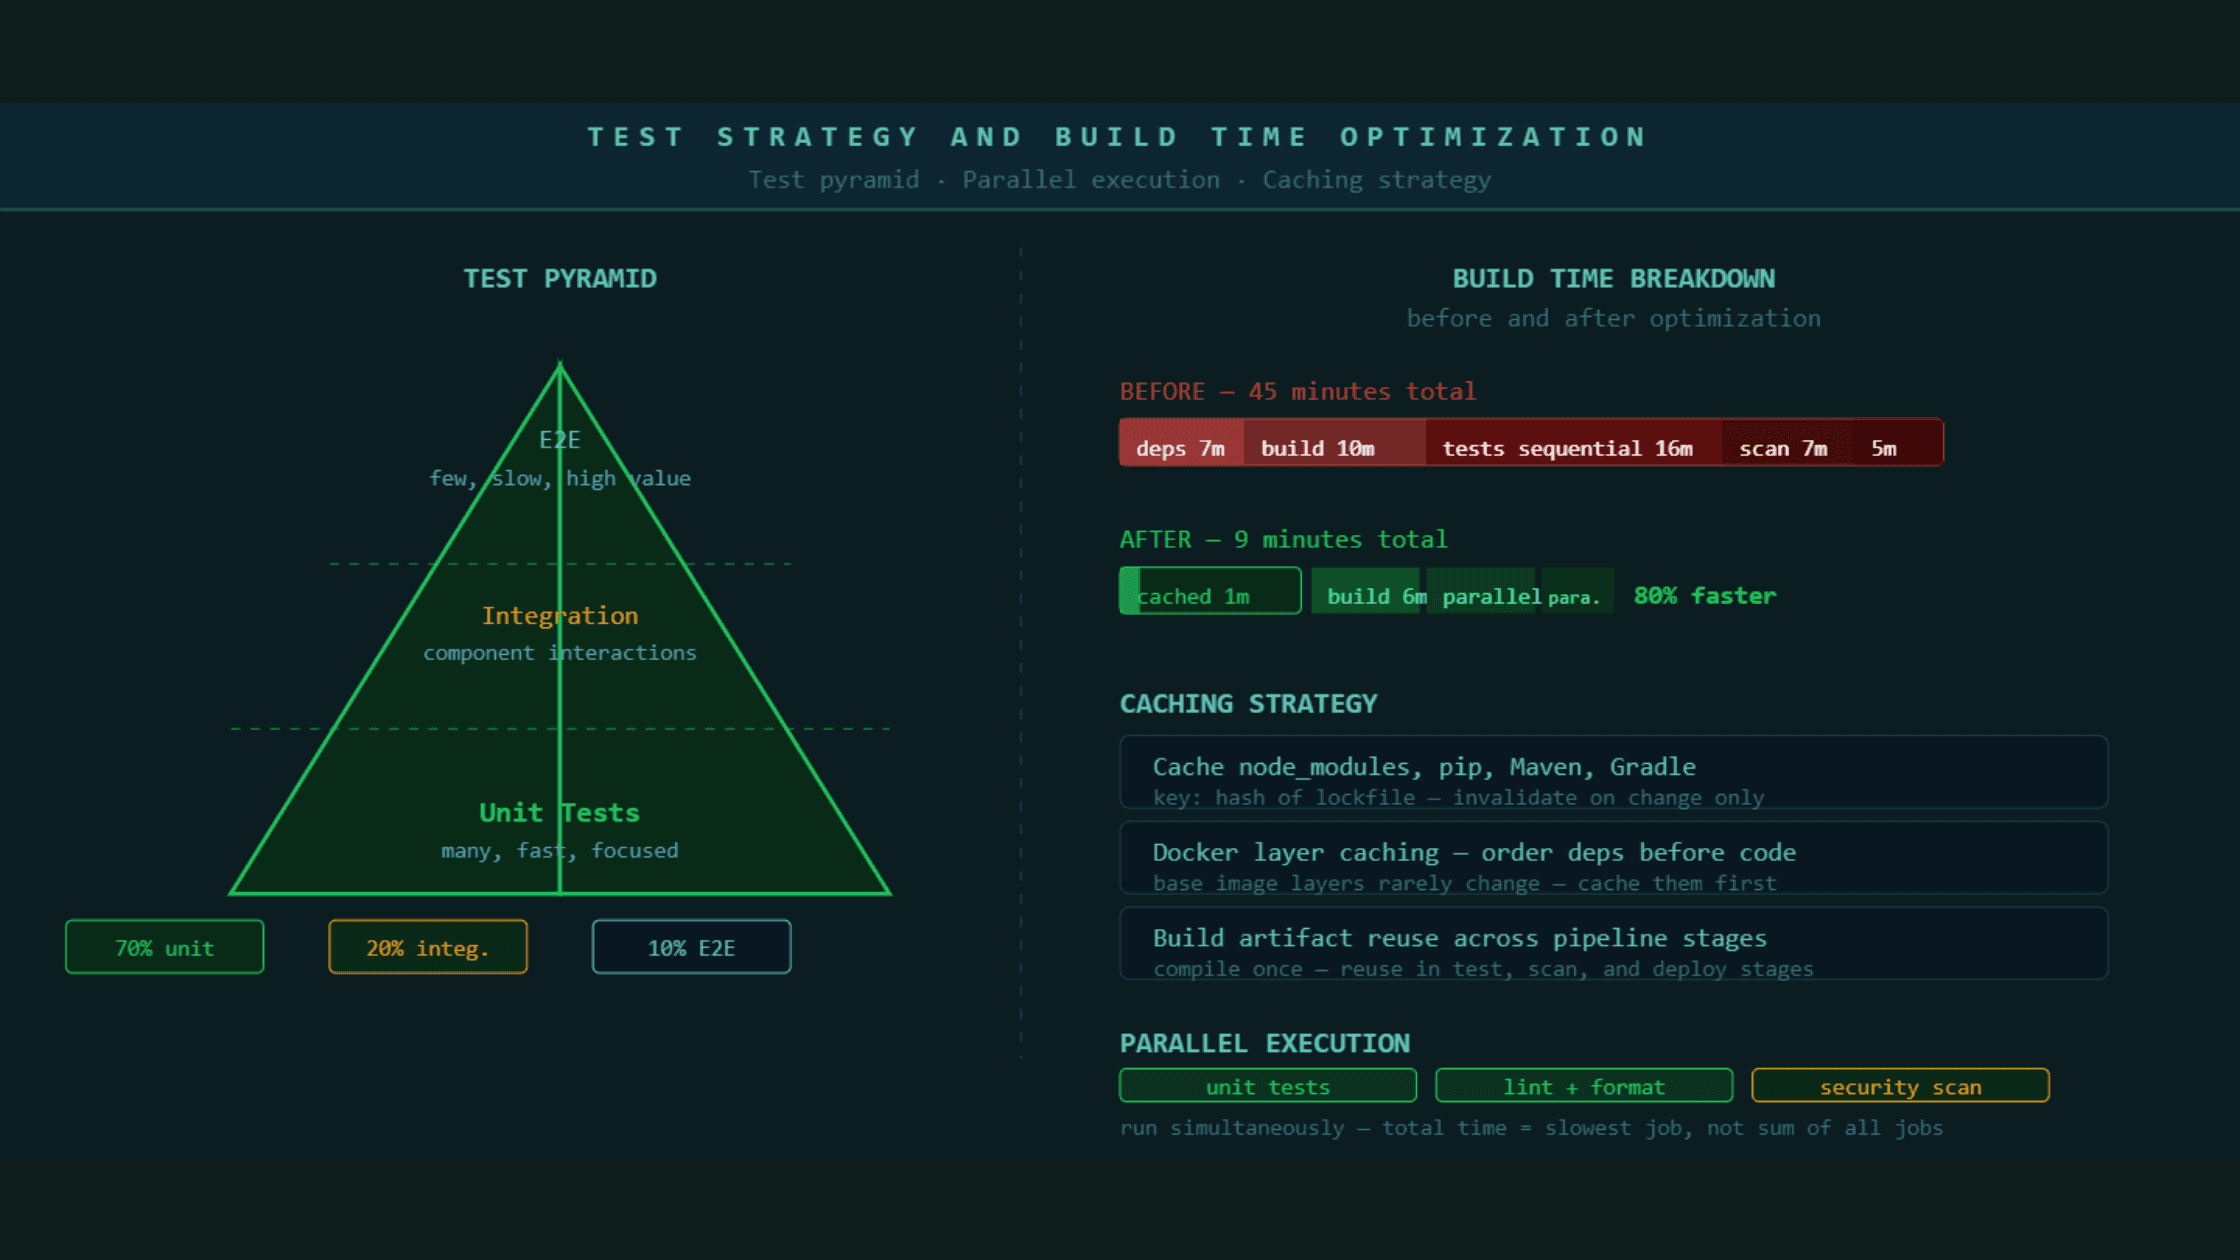
The most effective ways to keep builds fast are parallel test execution, where test suites run across multiple workers at the same time instead of sequentially, dependency caching so that packages are not re-downloaded on every run, and selective test triggering where only tests related to changed files run on a pull request while the full suite runs before main.
Most teams that have a 40 or 50 minute pipeline do not have 40 minutes worth of necessary work. They have accumulated steps that nobody has audited since they were added. Run a pipeline audit every quarter. Remove steps that are not catching real failures. Merge steps that can be parallelized. A pipeline that was 45 minutes can usually be 8 to 12 minutes with disciplined optimization and no reduction in coverage.
A CI pipeline over ten minutes is actively degrading developer productivity. Parallel execution, dependency caching, and selective testing almost always bring build times into the acceptable range without removing real quality checks.
Best Practice 2: Treat Security as a Pipeline Stage, Not an Afterthought
In 2026, shipping a security vulnerability to production is not primarily a security problem. It is a business continuity problem. Supply chain attacks, dependency vulnerabilities, and exposed secrets in build logs have all made headlines in the past two years. The teams that catch these issues early catch them in the pipeline, not in a quarterly audit.
DevSecOps means security checks run on every commit, not once a sprint in a separate security team workflow. The practical implementation involves four types of checks that should be automatic and blocking.
Static application security testing, commonly called SAST, analyzes your source code for common vulnerability patterns without running the code. It catches things like SQL injection risks, insecure deserialization, and hardcoded credentials before the code ever reaches a server. Dependency scanning checks every third-party package your application uses against known vulnerability databases. A library that was safe last month may have a critical CVE this month. Container image scanning checks the base images and layers in your Docker containers for known vulnerabilities before those images are pushed to a registry. Secrets detection scans every commit for accidentally committed API keys, passwords, and tokens. These are responsible for a significant proportion of production security incidents and they are almost entirely preventable with a pipeline check.
None of these checks require a security team to run them. They run automatically on every pull request and block merging if they find a critical finding. The cost of fixing a security issue at the commit stage is a fraction of the cost of fixing it after it reaches production.
Security checks built into the pipeline as blocking stages catch vulnerabilities at the cheapest possible moment in the development lifecycle. SAST, dependency scanning, container scanning, and secrets detection should run on every commit automatically.
Best Practice 3: Build Environments That Are Identical to Production
The most common class of deployment failures comes from differences between the environment where code was tested and the environment where it runs in production. This is such a well-documented problem that it has its own phrase: "it works on my machine."
Environment parity means your staging environment matches production as closely as technically and economically possible. Same operating system version. Same container base images. Same database version. Same environment variable structure with environment-specific values substituted. Same network configuration where practical.
Infrastructure as code is what makes environment parity achievable at scale. When your infrastructure is defined in Terraform, Pulumi, or similar tools and stored in version control, the same definition that creates staging creates production. There is no manual configuration drift because there is no manual configuration.
The places where environment parity most commonly breaks down are database versions, which are expensive to upgrade in production and often fall behind in staging, environment variables, where staging configs are frequently different in structure rather than just value, and external service mocking, where staging tests against fake versions of third-party services that behave differently from the real ones under load.
If a bug only appears in production and not in staging, the first question to ask is what is different between these environments. The answer will tell you where your environment parity has broken down.
Most deployment failures happen because staging and production are not actually identical. Infrastructure as code and container-based deployments close this gap more reliably than any other approach.
Best Practice 4: Test Smarter, Not More
Testing is the most expensive part of most CI pipelines in terms of time. The mistake most teams make is treating all tests as equally valuable and running all of them every time code changes.
The test pyramid is the framework that fixes this. At the base, you have unit tests. They are fast, isolated, and test individual functions or components. They should make up around 70 percent of your test suite. In the middle, you have integration tests that check how components interact. They take longer and should make up around 20 percent of your tests. At the top, you have end-to-end tests that simulate real user journeys. They are the slowest and most brittle, and they should make up around 10 percent of your tests.
The practical application in a pipeline is running unit tests on every commit with no exceptions. Running integration tests on pull requests targeting main. Running end-to-end tests before staging deployments but not on every feature branch push.
Beyond this, selective test execution based on changed files means that a change to the authentication module only triggers tests related to authentication on pull request. The full suite still runs before deployment to production. This alone can reduce pull request CI time by 40 to 60 percent on larger codebases.
What most teams discover when they audit their test suite is that a meaningful percentage of their tests are either not testing anything that could realistically fail, testing the same behavior as another test, or testing implementation details rather than behavior. Cleaning the test suite is as important as writing new tests.
Best Practice 5: Use Feature Flags to Separate Deployment From Release
One of the most important conceptual shifts in modern continuous delivery is separating the act of deploying code from the act of releasing a feature to users. These are two different decisions and treating them as one creates unnecessary risk.
Feature flags allow you to deploy code to production in a dormant state. The feature exists in the codebase and has been deployed, but no user can see it yet. When the business decides to release it, the flag is toggled on. This can happen gradually, to 1 percent of users first, then 10 percent, then 100 percent, without any new deployment.
The operational benefits are significant. Deployments become low-risk because you are pushing tested code that is not yet visible to users. Releases become reversible because turning off a flag takes seconds. A/B testing becomes structural rather than a special effort. And you can decouple the engineering release cycle from the business release calendar, which removes one of the most common sources of deployment anxiety.
Feature flags do introduce overhead. They need to be cleaned up after a feature is fully released. An accumulation of old, forgotten flags makes code hard to read. This cleanup should be treated as a standard part of the definition of done for every feature.
Best Practice 6: Measure What Actually Matters With DORA Metrics
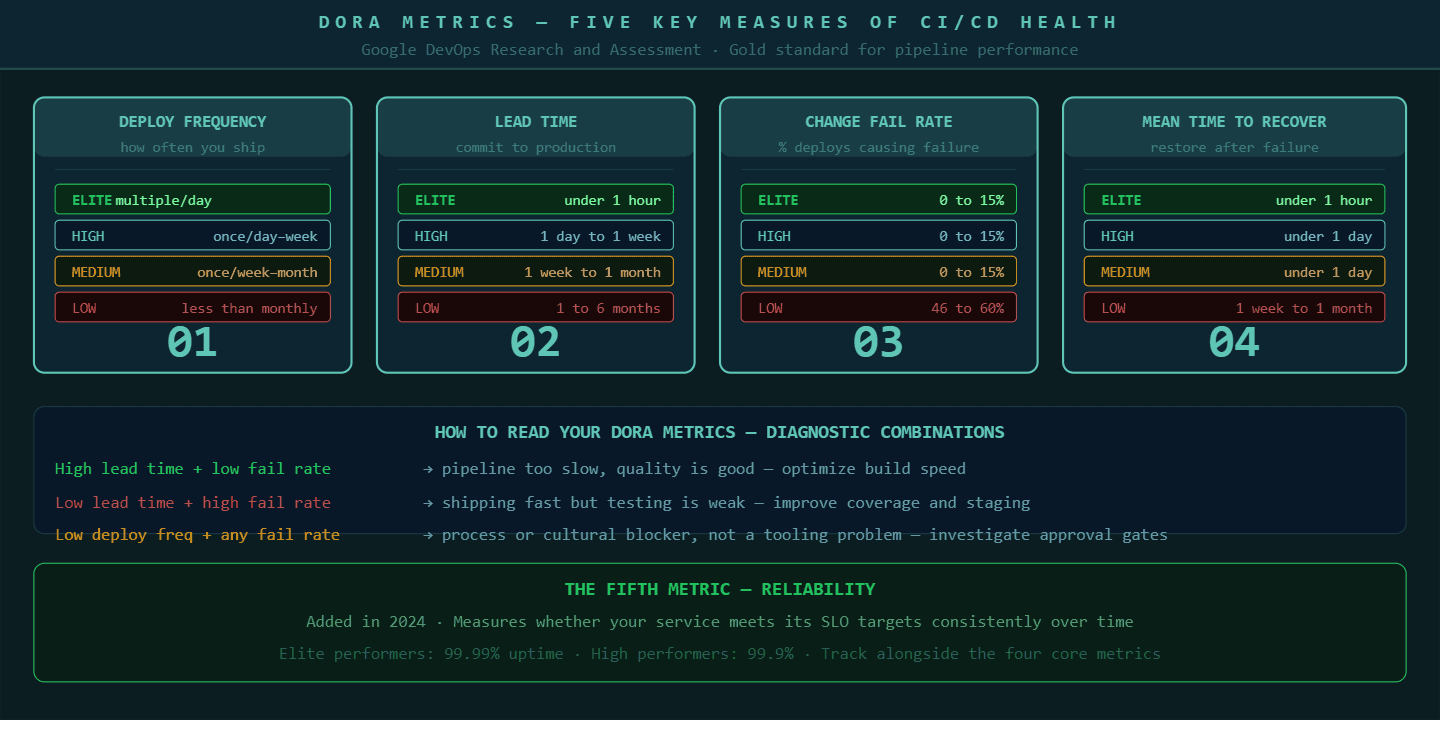
The DORA metrics, developed by Google's DevOps Research and Assessment team, are the closest thing the industry has to a universal standard for measuring CI/CD pipeline health. There are now five metrics in the framework.
Deployment frequency measures how often you deploy to production. Elite teams deploy multiple times per day. High performers deploy once per day to once per week. Teams deploying less than once per month have a structural problem in their pipeline or their process.
Lead time for changes measures the time from a code commit to that code running in production. Elite performers achieve this in under one hour. High performers achieve it in one day to one week.
Change failure rate measures the percentage of deployments that cause a failure requiring a fix or rollback. Elite and high performers keep this below 15 percent. If your change failure rate is above 30 percent, your test coverage or staging environment has a gap.
Mean time to recover measures how long it takes to restore service after a production incident. Elite performers recover in under one hour. This is largely a function of observability and automated rollback capability.
The fifth metric, reliability, measures whether your service is meeting its SLO targets consistently over time.
These metrics are not just numbers for reporting to leadership. They are diagnostic tools. A high lead time with a low change failure rate suggests your pipeline is too slow but your quality is good. A low lead time with a high change failure rate suggests you are moving fast but testing is insufficient. Each combination points to a different intervention.
DORA metrics give engineering teams a shared language for discussing CI/CD health and a diagnostic framework for deciding where to invest improvement effort.
Best Practice 7: Build Rollback Into Every Deployment, Not Just Some
Every deployment should have a tested, automated rollback path. Not a manual runbook. Not a "we can redeploy the previous version if needed." An actual automated rollback that triggers based on health check failures without requiring a human to make a decision at 2am.
The reason this matters is that the window between a bad deployment and its detection is usually short, but the window between detection and recovery is long if recovery requires human intervention. Automated rollback closes that window by attaching rollback triggers directly to the health checks that monitor your deployment.
A canary deployment strategy, where you release to 5 or 10 percent of users first and watch the error rate before promoting to 100 percent, is one of the most effective risk reduction approaches in continuous delivery. If the canary shows a higher error rate than baseline, the deployment rolls back automatically and the team gets a notification before most users ever experienced the failure.
For this to work, you need meaningful health checks. CPU and memory alone are not enough. You need application-level metrics: error rate per endpoint, latency at the 95th percentile, key business transaction success rates. These are the signals that tell you whether the application is actually working, not just whether the server is alive.
Best Practice 8: Observability Is a Pipeline Concern, Not Just an Operations Concern
The pipeline does not end when the code is deployed. The pipeline ends when you have confirmed that the deployment is healthy and the system is performing within expected parameters. Observability is how you make that confirmation.
Every service that goes through your CI/CD pipeline should be instrumented with the three pillars of observability before it reaches production. Metrics measure what is happening in aggregate, error rates, request volumes, and response times. Logs record what happened in specific transactions. Traces show how a request moved through distributed services and where time was spent.
P99Soft's platform engineering and DevOps practice builds observability into the pipeline architecture from the start. We work with teams to instrument services before they go live, not as a post-deployment concern. When something breaks in production, you find it in minutes because you know what to look for and where to look.
The Prometheus and Grafana stack has become the default for open-source observability in 2026. Datadog, New Relic, and Dynatrace serve teams that need more managed solutions. The tool matters less than the discipline: every service that ships through your pipeline should emit structured logs, expose metrics endpoints, and participate in distributed tracing before any user touches it.
The Common Thread in Every High-Performing Pipeline
Every engineering team that runs a genuinely high-performing CI/CD pipeline has one thing the struggling teams usually do not. They treat the pipeline itself as a product.
The pipeline has an owner. It has a roadmap. Someone reviews it quarterly and asks whether every stage is earning its place. There is a metric for pipeline health, usually build time and failure rate, that the team tracks the same way they track application performance. When the pipeline slows down or starts failing more often, it gets the same attention as a production incident.
Most teams treat the pipeline as plumbing. You set it up, and then you only look at it when something breaks. That approach produces pipelines that slowly accumulate technical debt, grow longer every month, and eventually become the thing everyone on the team dreads.
The teams deploying multiple times per day with a low change failure rate are the ones that keep their pipeline clean, fast, and observable. They invest in it the same way they invest in the product it delivers.
How P99soft Helps Engineering Teams Build Better CI/CD Pipelines
P99soft's Platform Engineering practice works with engineering teams at the system level: not just wiring up tools, but designing the delivery architecture that makes fast, reliable shipping possible.
Our work spans CI/CD implementation and optimization, Backstage consulting for internal developer platforms, DevSecOps integration, Kubernetes and infrastructure automation, and observability implementation with Prometheus and Grafana. We are a GitLab partner and have deep implementation experience across GitHub Actions, Jenkins, and Azure DevOps.
If your pipeline is slow, flaky, or nobody on the team fully trusts it, that is a solvable engineering problem. The practices above are the starting point. Reach out to the P99Soft team at p99soft.com and we can walk through where your delivery architecture has room to improve.
FAQ
What is a CI/CD pipeline and how does it work?
A CI/CD pipeline is an automated workflow that moves code from a developer's commit through build, test, security scanning, and deployment to production. Continuous integration handles building and testing automatically on every code change. Continuous delivery or deployment handles getting that tested code into production environments reliably. The goal is to reduce the time between writing code and delivering working software to users, while maintaining quality and security throughout.
How long should a CI/CD pipeline take?
A CI pipeline should complete in under ten minutes for most applications. Beyond ten minutes, developers context-switch to other work while waiting, which reduces productivity and increases the cost of fixing issues the pipeline finds. Build time above ten minutes is almost always reducible through parallel test execution, dependency caching, and removing stages that are not catching real failures.
What are DORA metrics and why do they matter for CI/CD?
DORA metrics are five key measurements developed by Google's DevOps Research and Assessment team: deployment frequency, lead time for changes, change failure rate, mean time to recover, and reliability. They matter because they give engineering teams a shared, objective framework for measuring whether their CI/CD pipeline is actually performing well. Elite performing teams deploy multiple times per day with a change failure rate below 15 percent and a mean time to recovery under one hour. These benchmarks show teams where they stand and what to fix.
What is the difference between continuous delivery and continuous deployment?
Continuous delivery means every code change that passes the pipeline is ready to deploy to production, but deployment requires a manual approval step. Continuous deployment means every code change that passes the pipeline deploys to production automatically with no human intervention. Most teams start with continuous delivery and move to continuous deployment as their test coverage and pipeline reliability matures. Feature flags make continuous deployment safer by allowing code to reach production in a dormant state before it is released to users.
Platform engineering Services: https://p99soft.com/service/platform-engineering, https://p99soft.com/service/backstage-consulting, https://p99soft.com/service/progressive-delivery, https://p99soft.com/service/ci-cd-developer-experience